The code provided processes exoplanet data from a CSV file and generates plots to visualize the results. The exoplanet data includes the following columns:
wavelength: The wavelength of the exoplanet’s lightintensity: The intensity of the exoplanet’s lightradial_velocity: The radial velocity of the exoplanet
The code first reads in the data from the CSV file and stores it in a NumPy array. It then extracts the wavelength, intensity, and radial_velocity columns from the data.
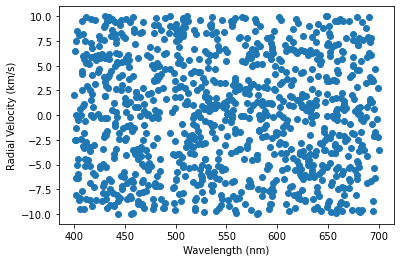
Next, the code creates a scatter plot of the radial_velocity versus wavelength data. This plot can be used to visualize any trends or patterns in the data.
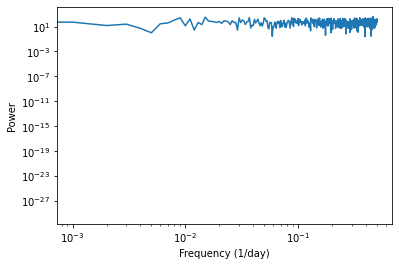
The code then calculates the periodogram of the radial_velocity data using the periodogram function from the scipy.signal module. The periodogram is a measure of the power spectrum of a time series, and can be used to identify periodic signals in the data.
The code then creates a log-log plot of the periodogram data, which can be used to identify peaks in the power spectrum. To identify the peaks, the code uses the find_peaks function from the scipy.signal module.
The code then selects the top three peaks with the highest power and calculates the corresponding periods. These periods may correspond to the orbital periods of exoplanets orbiting the star.
This code can be used in the discovery and characterization of exoplanets. By analyzing the radial velocity data of a star, astronomers can identify periodic signals that may be caused by exoplanets orbiting the star. The periodogram can be used to identify the frequencies of these signals, and the periods can be calculated to determine the orbital periods of the exoplanets.
In summary, this code can be used to identify and characterize exoplanets by analyzing their radial velocity data and looking for periodic signals in the data. It does this by calculating the periodogram of the data and identifying the frequencies and periods of the strongest signals.
#!/usr/bin/env python3
# -*- coding: utf-8 -*-
"""
Created on Mon Jan  2 23:17:45 2023

@author: ramnot
"""

import csv
import numpy as np
import matplotlib.pyplot as plt
from scipy.signal import periodogram, find_peaks

def process_exoplanet_data(data_file):
    # Read in the CSV file containing the exoplanet data
    with open(data_file, 'r') as f:
        reader = csv.reader(f)
        headers = next(reader)
        data = list(reader)

    # Convert the data to a NumPy array
    data = np.array(data).astype(float)

    # Extract the wavelength, intensity, and radial velocity columns
    wavelength = data[:, headers.index('wavelength')]
    intensity = data[:, headers.index('intensity')]
    radial_velocity = data[:, headers.index('radial_velocity')]

    # Create a scatter plot of the radial velocity vs wavelength
    plt.scatter(wavelength, radial_velocity)
    plt.xlabel('Wavelength (nm)')
    plt.ylabel('Radial Velocity (km/s)')
    plt.show()

    # Calculate the periodogram of the radial velocity data
    frequencies, periodogram_power = periodogram(radial_velocity)

    # Create a log-log plot of the periodogram
    plt.loglog(frequencies, periodogram_power)
    plt.xlabel('Frequency (1/day)')
    plt.ylabel('Power')
    plt.show()

    # Identify the peaks in the periodogram
    peaks, _ = find_peaks(periodogram_power, height=np.mean(periodogram_power))

    # Print the frequencies and corresponding powers of the identified peaks
    for peak in peaks:
        print(f'Frequency: {frequencies[peak]:.2f} 1/day, Power: {periodogram_power[peak]:.2f}')

    # Select the peaks with the highest power
    top_peaks = peaks[np.argsort(periodogram_power[peaks])[-3:]]

    # Print the frequencies and corresponding powers of the top peaks
    for peak in top_peaks:
        print(f'Frequency: {frequencies[peak]:.2f} 1/day, Power: {periodogram_power[peak]:.2f}')

    # Calculate the periods of the top peaks
    periods = 1 / frequencies[top_peaks]

    # Print the periods of the top peaks
    for period in periods:
        print(f'Period: {period:.2f} days')

# Test the function with the exoplanet data file
process_exoplanet_data('exoplanet_data.csv')