This code uses the Matplotlib library to plot a 3D scatter plot of a set of data points.
The code starts by importing the matplotlib.pyplot and Axes3D modules from Matplotlib, and the KNeighborsClassifier class from the scikit-learn library.
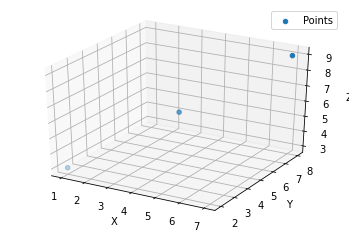
Then, the code defines a 3D model as a list of points, each represented as a tuple of three coordinates (x, y, z).
Next, the code creates a figure and an Axes3D object using Matplotlib, and extracts the x, y, and z coordinates from the 3D model using a list comprehension. The code then plots the points in 3D space using the scatter() method of the Axes3D object, and adds a legend using the legend() method.
Finally, the code adds labels to the x, y, and z axes using the set_xlabel(), set_ylabel(), and set_zlabel() methods, and displays the plot using the show() method of the pyplot module.
RAMNOT’s Potential Builds:
- Displaying real-time updates about the location and orientation of a spacecraft or other vehicle in 3D space.
- Overlaying a 3D model of the environment on the astronaut’s field of view to help them navigate and explore unfamiliar environments.
- Displaying real-time telemetry data, such as the astronaut’s location, heading, and altitude, in a 3D visualization.
- Providing visualizations of the astronaut’s path and progress as they explore an environment.
- Displaying real-time video feeds from cameras or other sensors in a 3D visualization.
- Overlaying data from scientific instruments, such as spectrometers or particle detectors, on a 3D model of the environment.
- Providing visualizations of the local weather, including temperature, humidity, and wind speed, in a 3D model of the environment.
- Displaying real-time updates about the local flora and fauna, including identification and classification of species.
- Overlaying data about the local geology and geochemistry on a 3D model of the environment.
- Displaying real-time updates about the history and cultural significance of the environment being explored.
- Providing visualizations of the locations of potential hazards in the environment, such as sharp rock formations or unstable ground.
- Displaying real-time updates about the local atmosphere and air quality in a 3D model of the environment.
- Providing visualizations of the locations of historical and cultural sites in the environment.
- Displaying real-time translations of written or spoken languages in a 3D model of the environment.
- Providing visualizations of the locations of geological features and other points of interest in the environment.
- Displaying real-time updates about the local flora and fauna, including identification and classification of species.
- Providing visualizations of the locations of atmospheric conditions and air quality hotspots in the environment.
- Displaying real-time updates about the history and evolution of the environment being explored.
- Providing visualizations of objects or features in the environment, such as rocks, minerals, or vegetation, and their properties.
- Displaying real-time updates about patterns or trends in the data that may be useful for exploration or navigation.
import matplotlib.pyplot as plt
from sklearn.neighbors import KNeighborsClassifier
from mpl_toolkits.mplot3d import Axes3D

# Example data
model = [
    [1, 2, 3],
    [4, 5, 6],
    [7, 8, 9]
]

fig = plt.figure()
ax = fig.add_subplot(111, projection='3d')

# Extract the x, y, and z coordinates from the 3D model
xs = [point[0] for point in model]
ys = [point[1] for point in model]
zs = [point[2] for point in model]

# Plot the points in 3D space
ax.scatter(xs, ys, zs, label='Points')

# Add a legend
ax.legend()

# Add labels to the axes
ax.set_xlabel('X')
ax.set_ylabel('Y')
ax.set_zlabel('Z')

plt.show()