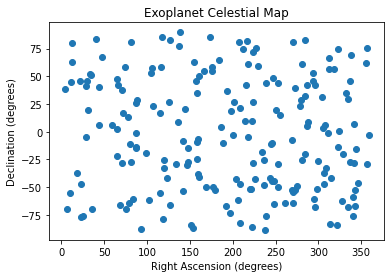
This script generates a map of exoplanets (planets outside of our solar system). The map is a scatter plot with the right ascension of the exoplanets on the x-axis and their declination on the y-axis. The right ascension and declination are given in hours and degrees, respectively. The script first generates a list of tuples, where each tuple represents an exoplanet with its right ascension and declination. The right ascensions are then converted from hours to degrees and the resulting data is plotted using the matplotlib library. Finally, the plot is displayed using plt.show().
#!/usr/bin/env python3
# -*- coding: utf-8 -*-
"""
Created on Sun Jan  1 11:06:51 2023

@author: ramnot
"""
import matplotlib.pyplot as plt
import random

def generate_exoplanet_map(num_exoplanets):
    exoplanet_map = []
    for i in range(num_exoplanets):
        ra = random.uniform(0, 24)  # Right ascension in hours
        dec = random.uniform(-90, 90)  # Declination in degrees
        exoplanet = (ra, dec)
        exoplanet_map.append(exoplanet)
    return exoplanet_map

num_exoplanets = 200
exoplanet_map = generate_exoplanet_map(num_exoplanets)
print(exoplanet_map)

# Extract right ascensions and declinations from the exoplanet map
ras, decs = zip(*exoplanet_map)

# Convert right ascensions from hours to degrees
ras = [ra * 15 for ra in ras]  # 1 hour = 15 degrees

# Create a scatter plot
plt.scatter(ras, decs)

# Add a title and axis labels
plt.title("Exoplanet Celestial Map")
plt.xlabel("Right Ascension (degrees)")
plt.ylabel("Declination (degrees)")

# Show the plot
plt.show()