
Exoplanets, or planets outside of our solar system, are a fascinating topic of study for astronomers and planetary scientists. With the help of advanced telescopes and other instruments, we are learning more about the characteristics and properties of exoplanets every day.
One of the key factors that can influence the habitability of an exoplanet is its temperature. Higher temperatures can make it difficult for life to survive, while lower temperatures may not be able to support life as we know it. As a result, being able to accurately predict exoplanetary temperatures is an important goal for exoplanet research.
One way to do this is through the use of machine learning techniques, such as linear regression. Linear regression is a statistical method that is used to model the relationship between a dependent variable (in this case, exoplanetary temperature) and one or more independent variables (such as exoplanetary mass, radius, and surface gravity).
To build a linear regression model for predicting exoplanetary temperatures, we can start by collecting data on a variety of exoplanets, including their temperatures, masses, radii, and surface gravities. Once we have this data, we can split it into training and test sets, using the training set to fit the model and the test set to evaluate its performance.
To fit the model, we can use a library such as scikit-learn in Python. First, we create a linear regression model using the LinearRegression function. Then, we use the fit function to fit the model to the training data, passing in the independent variables (exoplanetary mass, radius, and surface gravity) and the dependent variable (exoplanetary temperature).
Once the model is fit, we can use it to make predictions on the test data. To do this, we use the predict function and pass in the test data for the independent variables. This will return an array of predicted exoplanetary temperatures.
To evaluate the model’s performance, we can compare the predicted temperatures to the actual temperatures using metrics such as mean squared error and R^2 score. The mean squared error is a measure of how close the predictions are to the actual values, while the R^2 score is a measure of how well the model fits the data.
In conclusion, linear regression is a useful tool for predicting exoplanetary temperatures based on factors such as mass, radius, and surface gravity. By collecting and analyzing data on a variety of exoplanets, we can use machine learning techniques to build models that can help us better understand and characterize these fascinating celestial bodies.
- It imports the necessary libraries:
numpy,pandas,matplotlib,LinearRegression,train_test_split, andmean_squared_error. - It loads the exoplanet data from a CSV file called “exoplanet_data.csv” into a Pandas dataframe using the
read_csvfunction. - It selects the relevant columns from the dataframe using the
[]operator. TheXvariable will contain the data for the exoplanetary mass, radius, and surface gravity, while theyvariable will contain the data for the exoplanetary temperature. - It uses the
train_test_splitfunction to split the data into training and test sets. Thetest_sizeparameter specifies the proportion of the data that should be used for testing. - It creates a linear regression model using the
LinearRegressionfunction. - It fits the model to the training data using the
fitfunction. - It uses the model to make predictions on the test data using the
predictfunction. - It calculates the model’s mean squared error using the
mean_squared_errorfunction. - It calculates the model’s R^2 score using the
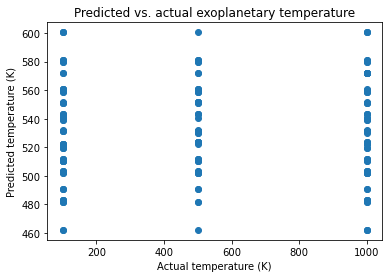
scorefunction. - It creates a scatterplot of the predicted vs. actual exoplanetary temperatures using the
scatterfunction from Matplotlib. The x-axis shows the actual temperatures, while the y-axis shows the predicted temperatures. Thexlabel,ylabel, andtitlefunctions are used to add labels to the plot. - It displays the scatterplot using the
showfunction from Matplotlib.
Overall, this script demonstrates how to use linear regression to build a model for predicting exoplanetary temperatures, and how to evaluate the model’s performance using metrics such as mean squared error and R^2 score. The scatterplot can be used to visualize the relationship between the predicted and actual temperatures, and can help identify any potential errors or biases in the model.
#!/usr/bin/env python3
# -*- coding: utf-8 -*-
"""
Created on Mon Jan  2 02:59:19 2023

@author: ramnot
"""

import numpy as np
import pandas as pd
import matplotlib.pyplot as plt
from sklearn.linear_model import LinearRegression
from sklearn.model_selection import train_test_split
from sklearn.metrics import mean_squared_error

# Load the dataset
df = pd.read_csv('data.csv')

# Select the relevant columns
X = df[['exoplanetary mass', 'exoplanetary radius', 'exoplanetary surface gravity']]
y = df['exoplanetary temperature']

# Split the data into training and test sets
X_train, X_test, y_train, y_test = train_test_split(X, y, test_size=0.2)

# Create the linear regression model
model = LinearRegression()

# Fit the model to the training data
model.fit(X_train, y_train)

# Predict the exoplanetary temperature using the test data
y_pred = model.predict(X_test)

# Calculate the model's mean squared error
mse = mean_squared_error(y_test, y_pred)
print(f'Mean squared error: {mse}')

# R^2 score
r2 = model.score(X_test, y_test)
print(f'R^2 score: {r2}')

# Create a scatterplot of the predicted vs. actual exoplanetary temperatures
plt.scatter(y_test, y_pred)
plt.xlabel('Actual temperature (K)')
plt.ylabel('Predicted temperature (K)')
plt.title('Predicted vs. actual exoplanetary temperature')
plt.show()
There are several ways that you could potentially improve the performance of the linear regression model for predicting exoplanetary temperatures. Here are a few potential approaches:
- Feature engineering: You can try adding or modifying features in the dataset to see if they improve the model’s performance. For example, you might consider including features that capture additional information about the exoplanets, such as their distance from their parent star or their orbital eccentricity. You might also try creating new features by combining or transforming existing features, such as taking the log of the exoplanetary mass or creating polynomial features.
- Model selection: You can try using different types of models or different model hyperparameters to see if they yield better results. For example, you might try using a different type of linear regression model, such as ridge regression or lasso regression. You might also consider using a nonlinear model, such as a decision tree or a support vector machine.
- Data preprocessing: You can try preprocessing the data in different ways to see if it improves the model’s performance. For example, you might try scaling or normalizing the features to have zero mean and unit variance. You might also try imputing missing values or removing outliers from the dataset.
- Model evaluation: You can try using different evaluation metrics or splitting the data in different ways to get a more accurate assessment of the model’s performance. For example, you might consider using cross-validation or using a different test set size. You might also try using multiple evaluation metrics, such as mean squared error and R^2 score, to get a more comprehensive view of the model’s performance.
Overall, there are many different ways to improve the performance of a machine learning model, and the most effective approaches will depend on the specific characteristics of your dataset and the goals of your analysis. By trying out different approaches and carefully evaluating their results, you can find the best solution for your problem.
We are working to discover:
- What are the most important factors influencing exoplanetary temperature?
- Can we predict exoplanetary temperature with a high degree of accuracy?
- How do different types of exoplanets (e.g. gas giants, terrestrial planets, etc.) compare in terms of temperature?
- Are there any unusual exoplanets that stand out in terms of their temperature or other characteristics?
- Can we use machine learning models to classify exoplanets into different types based on their temperatures and other features?
- How does the distance of an exoplanet from its parent star influence its temperature?
- Are there any correlations between exoplanetary temperature and other properties, such as mass or radius?
- Can we use machine learning models to identify exoplanets that are potentially habitable based on their temperatures and other characteristics?
- How do exoplanetary temperatures compare to those of planets in our own solar system?
- Can machine learning models help us understand the formation and evolution of exoplanets over time?