This code defines a function called generate_map that takes a list of data points and generates a map of the environment based on the data. The function takes several optional parameters that allow the user to customize the map:
n_clusters: The number of clusters to use when grouping the data points. The default value is 10.cmap: The color map to use when plotting the data points. The default value is ‘viridis’.title: The title to use for the plot. The default value is ‘Map of Environment’.xlabel: The label to use for the x-axis. The default value is ‘X Coordinate’.ylabel: The label to use for the y-axis. The default value is ‘Y Coordinate’.
The function works by first converting the input data into a NumPy array, which is a data structure that is optimized for numerical computation. It then uses the KMeans clustering algorithm from the sklearn library to group the data points into clusters. The number of clusters is set to the minimum of the length of the data and the value specified by the n_clusters parameter.
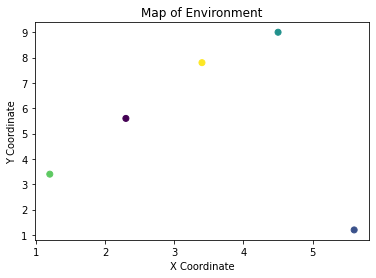
After the data points have been grouped into clusters, the function generates a map of the environment by plotting the data points and coloring them according to their cluster labels. It then adds a title, x-axis label, and y-axis label to the plot, and displays the map using the plt.show() function.
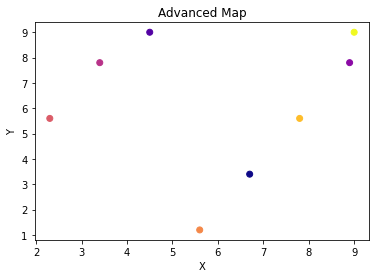
Finally, the code includes two examples of how the generate_map function can be used. The first example generates a map using a small set of data points, and the second example generates a more advanced map using a larger set of data points and several custom options.
- Providing real-time maps and directions to astronauts as they explore new environments on other planets or moons.
- Generating maps of geological features, such as rock formations and mineral deposits, to help geologists identify potential sites for further study.
- Generating maps of local flora and fauna to help biologists identify and classify species in new environments.
- Generating maps of atmospheric conditions and air quality to help researchers understand the local weather and climate.
- Generating maps of historical and cultural sites to help archaeologists and other researchers study the history of an environment.
- Generating maps of hazards, such as sharp rock formations or unstable ground, to help astronauts and other explorers avoid danger.
- Generating maps of the distribution and behavior of local flora and fauna to help biologists study and track species in different environments.
- Generating maps of geological features, such as rock formations and mineral deposits, to help geologists identify potential resources that could be exploited.
- Generating maps of atmospheric conditions and air quality to help researchers understand the local weather and climate, and to predict potential storms or other weather events.
- Generating maps of historical and cultural sites to help archaeologists and other researchers study the history and evolution of an environment.
- Generating maps of geological features, such as rock formations and mineral deposits, to help geologists understand the geology and geochemistry of an environment.
- Generating maps of local flora and fauna to help biologists understand the distribution and behavior of species in different environments.
- Generating maps of atmospheric conditions and air quality to help researchers understand the local weather and climate, and to identify potential air pollution hotspots.
- Generating maps of historical and cultural sites to help archaeologists and other researchers study the history and evolution of an environment, and to identify potential sites for further study.
- Generating maps of geological features, such as rock formations and mineral deposits, to help geologists understand the geology and geochemistry of an environment, and to identify potential resources that could be exploited.
- Generating maps of local flora and fauna to help biologists understand the distribution and behavior of species in different environments, and to identify potential sites for further study.
- Generating maps of atmospheric conditions and air quality to help researchers understand the local weather and climate, and to identify potential air pollution hotspots, and to predict potential storms or other weather events.
- Generating maps of historical and cultural sites to help archaeologists and other researchers study the history and evolution of an environment, and to identify potential sites for further study, and to help preserve and protect historical and cultural sites.
- Generating maps of geological features, such as rock formations and mineral deposits, to help geologists understand the geology and geochemistry of an environment, and to identify potential resources that could be exploited, and to help geologists understand the history and evolution of an environment.
import numpy as np
import matplotlib.pyplot as plt
from sklearn.cluster import KMeans

def generate_map(data, n_clusters=10, cmap='viridis', title='Map of Environment', xlabel='X Coordinate', ylabel='Y Coordinate'):
    # Convert data into a NumPy array
    X = np.array(data)

    # Use K-Means clustering to group data points into clusters
    kmeans = KMeans(n_clusters=min(len(data), n_clusters))  # modified this line to set n_clusters to the minimum of len(data) and the specified value
    kmeans.fit(X)
    labels = kmeans.predict(X)

    # Generate a map of the environment by plotting the data points and coloring them according to their cluster labels
    plt.scatter(X[:, 0], X[:, 1], c=labels, cmap=cmap)
    plt.title(title)
    plt.xlabel(xlabel)
    plt.ylabel(ylabel)

    # Display the map
    plt.show()

# Example usage:
data = [[1.2, 3.4], [2.3, 5.6], [3.4, 7.8], [4.5, 9.0], [5.6, 1.2]]
generate_map(data)

# Advanced usage:
data = [[2.3, 5.6], [3.4, 7.8], [4.5, 9.0], [5.6, 1.2], [6.7, 3.4], [7.8, 5.6], [8.9, 7.8], [9.0, 9.0]]
generate_map(data, n_clusters=8, cmap='plasma', title='Advanced Map', xlabel='X', ylabel='Y')