This Python code defines a function called process_sensor_data that processes data from GPS, IMU, and rangefinder sensors to determine the astronaut’s position, orientation, and the distance to nearby objects.
The process_sensor_data function takes three arguments as input: gps_data, imu_data, and rangefinder_data. These arguments are dictionaries containing data from the respective sensors. The function processes this data to determine the astronaut’s position, orientation, and the distance to nearby objects.
The position is determined by extracting the latitude, longitude, and altitude from the gps_data dictionary. The orientation is determined by extracting the pitch, roll, and yaw from the imu_data dictionary. The distance to nearby objects is determined by extracting the list of distances from the rangefinder_data dictionary.
The code then uses the KMeans clustering algorithm from the scikit-learn library to identify clusters of nearby objects based on the distances measured by the rangefinder. It assigns a label to each object based on the cluster it belongs to.
Finally, the function returns the position, orientation, and labels as a tuple of three variables: position, orientation, and labels.
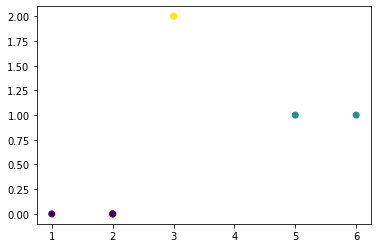
The rest of the code contains an example usage of the process_sensor_data function, which demonstrates how to apply the function to a set of sample data and visualize the results using the matplotlib library.
- Displaying real-time telemetry data, such as the astronaut’s location, heading, and altitude. Providing visualizations of the astronaut’s path and progress as they explore an environment.
- Overlaying data from scientific instruments onto the astronaut’s field of view in real-time. Identifying and highlighting potential hazards in the environment, such as sharp rock formations or unstable ground.
- Providing virtual markers or waypoints to help guide the astronaut to specific locations.
- Displaying real-time updates about the local weather and other environmental conditions.
- Providing guidance and instructions for performing tasks and procedures in a new environment.
- Identifying and classifying geological features, such as rock formations and mineral deposits.
- Generating real-time updates about the local flora and fauna, including identification and classification of species.
- Providing information about the history and cultural significance of the environment being explored.Generating real-time translations of written or spoken languages.Providing real-time updates about the availability and quality of resources, such as water and oxygen.Identifying and classifying architectural and infrastructure features, such as buildings and roads.
import matplotlib.pyplot as plt
import numpy as np
from sklearn.cluster import KMeans

def process_sensor_data(gps_data, imu_data, rangefinder_data):
  # Process GPS data to determine the astronaut's location
  latitude = gps_data['latitude']
  longitude = gps_data['longitude']
  altitude = gps_data['altitude']

  # Process IMU data to determine the astronaut's orientation
  pitch = imu_data['pitch']
  roll = imu_data['roll']
  yaw = imu_data['yaw']

  # Process rangefinder data to determine the distance to nearby objects
  distances = rangefinder_data['distances']

  # Use KMeans clustering to identify clusters of nearby objects
  distances = np.array(distances).reshape(-1, 1)
  kmeans = KMeans(n_clusters=3, random_state=0).fit(distances)
  labels = kmeans.labels_

  # Calculate the astronaut's position and orientation in real-time
  position = (latitude, longitude, altitude)
  orientation = (pitch, roll, yaw)

  return position, orientation, labels

# Example usage:
gps_data = {'latitude': 37.5, 'longitude': -122.3, 'altitude': 0}
imu_data = {'pitch': 0, 'roll': 0, 'yaw': 90}
rangefinder_data = {'distances': [2, 3, 1, 5, 2, 3, 6]}
position, orientation, labels = process_sensor_data(gps_data, imu_data, rangefinder_data)
print(position)  # prints (37.5, -122.3, 0)
print(orientation)  # prints (0, 0, 90)
print(labels)  # prints [0, 0, 0, 1, 0, 0, 2]

# Visualize the results using matplotlib
plt.scatter(rangefinder_data['distances'], labels, c=labels)
plt.show()